Real-time operational visibility - from leadership to shop floor
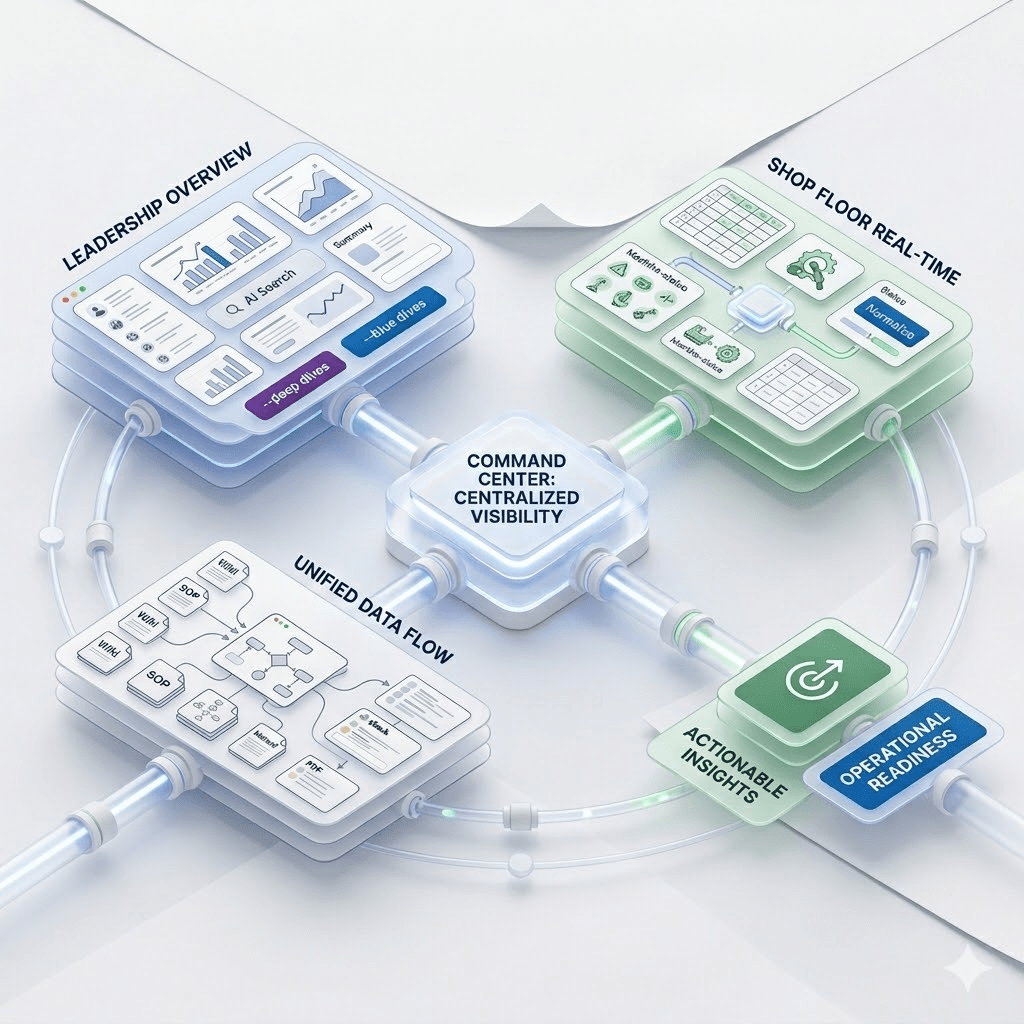
We transform siloed operational data into real-time command center dashboards that actually drive action.
Trusted by operations teams outgrowing manual work
100%
Automated Reporting
Real-Time
Decision Making
Unified
Connected Systems
Why operations leaders are flying blind
Outdated Reports
Weekly reports that are outdated and irrelevant before they are even read.
No Drill-down
Leadership unable to drill into anomalies without requesting custom IT support.
Excel Heavy
15+ spreadsheets attempting to act as a single source of operational truth.
Disconnected KPIs
Different departments measure performance using separate reports, making it difficult to understand the complete operational picture.
Decisions Based on Assumptions
Without timely, reliable data, managers often rely on estimates instead of operational facts when making critical decisions.
Limited Operational Visibility
Leaders can see what happened but struggle to understand where issues started or how they impact the rest of the business.
How we deploy Dashboards & Reporting
01. Consolidate
We audit your existing operational silos and map the data flow for extraction.
02. Connect
We build secure bi-directional API bridges between your core systems.
03. Automate
We deploy the custom AI agents and deterministic logic to handle the work.
04. Improve
We provide a real-time command center to monitor and optimize performance.
Dashboard and reporting capabilities
Real-time Data Pipes
Automated ingestion from ERP and SCADA directly into PowerBI or Tableau.
Explore CapabilityAnomaly Alerting
Visual alerts that trigger automatically when operational metrics fall outside thresholds.
Explore CapabilityCustom UI/UX
Dashboards designed specifically for shop floor tablets or executive boardrooms.
Explore CapabilityExecutive KPI Dashboards
Role-based dashboards that surface the metrics each team needs, from executives to plant supervisors.
Explore CapabilityInteractive Drill-Down Analytics
Move from high-level KPIs to individual orders, machines, products, or transactions with a few clicks.
Explore CapabilityCross-System Reporting
Combine ERP, MES, CRM, PLC, SCADA, SQL, and other business data into a single operational view without switching applications.
Explore CapabilityWe integrate your ERP, MES, PLC, SCADA, and SQL data into a single operational dashboard—without disrupting existing workflows
100%
Custom Dashboards
Zero
Manual Reports

Why operations teams choose Inevia
| Feature | Inevia | Generic Tools | Enterprise Platforms |
|---|---|---|---|
| Real-Time Dashboards | Live data | Limited | Static |
| ERP/MES Integration | Native integrations | Custom work | Manual |
| Drill-Down Analytics | Interactive | Basic | No |
| Mobile & Tablet Ready | Optimized | Basic | No |
| AI Insights | Built-in | Not included | No |
Frequently Asked Questions
Not at all. Most organizations come to us precisely because their data is siloed and messy. Data cleanup and API connectivity are the very first steps we handle in our methodology to make your environment AI-ready.
We deploy in rapid cycles. While a full implementation is ongoing, you will see your first automated workflow running in production within 2 to 4 weeks of the initial Operations Audit.
Traveler acts as the intelligent agent that moves between your fragmented systems (like SAP, Salesforce, and PLM) to execute specific tasks. Launchpad serves as your centralized command center, allowing leadership to monitor these agents, manage triggers, and visualize the resulting data flows.
Absolutely not. Inevia guarantees zero-retention policies for all operational data passing through our pipelines. Your internal knowledge base and proprietary workflows remain strictly within your private, secure environment.
Get real-time visibility today.
Stop guessing. Start knowing exactly what is happening in your operation.
Request Operations Audit